
Patek Philippe introduces a brand new collection named Cubitus

AHS Properties marks a milestone with an AED 130mln sale of its “Searenity” Villa on Palm Jumeirah

The Milestone 10th edition of Dubai Design Week is now open

"The 1001 Seasons of Elie Saab" event dazzles Riyadh Season with Glamour

DAMAC Properties unveils DAMAC Islands, inspired by most desirable global island destinations


Non-oil merchandise trade through the ports of Abu Dhabi grows 15.7 percent in Q2, 2015
By olya Wednesday, 16 September 2015 6:14 PM
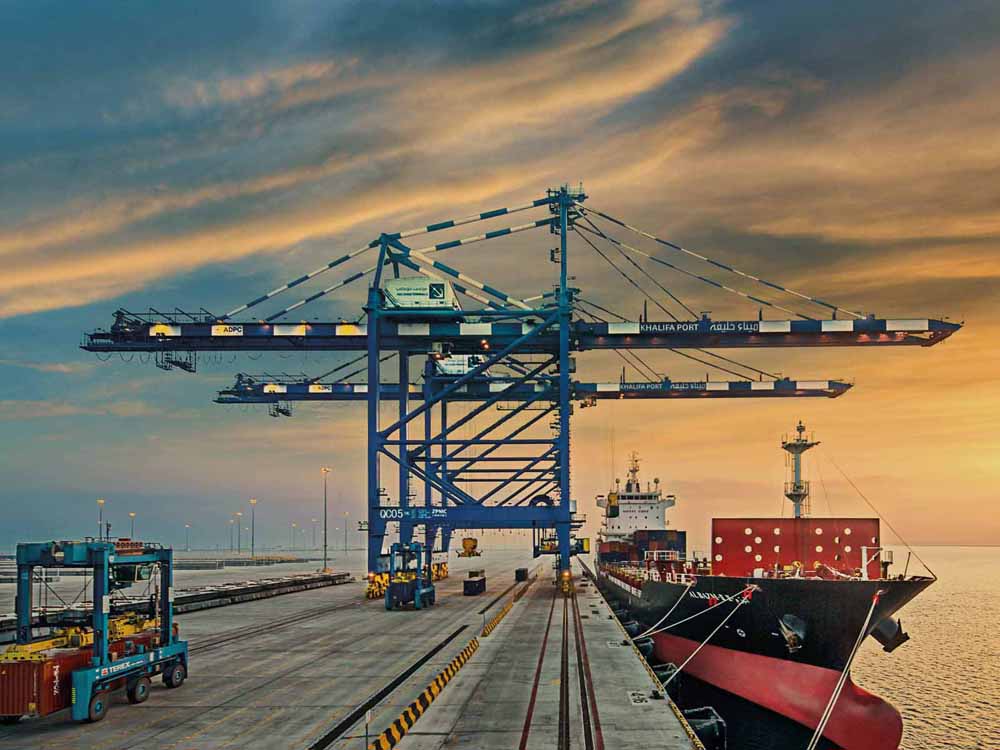
The Statistics Centre - Abu Dhabi, SCAD, today issued its quarterly report on non-oil merchandise trade through the ports of the Emirate of Abu Dhabi for Q2 2015, to support decision makers and businesses with accurate and up to date statistics on the non-oil merchandise that entered or exited the territory of Abu Dhabi through the emirate’s ports (including air, sea and land ports) during the reference period, highlighting the relative importance of each component. The report data does not exhaustively cover Abu Dhabi’s foreign trade, since a considerable proportion of it flows through the ports of other emirates.
The total value of non-oil foreign merchandise trade in Q2 2015 was AED 42.4 billion, an increase of AED 5.8 billion (15.7%) compared with Q2 2014, reflecting an increase of AED 1.7 billion (up 6.1 percent y-o-y) in non-oil imports, an increase of 4.4 billion (up 97.5 percent y-o-y) in non-oil exports, offset partially by a decrease of AED 335 million in re-exports during Q2 2015. Imports, non-oil exports and re-exports contributed 68.9 percent, 21.1 percent and 10.0 percent, respectively, of total merchandise trade through Abu Dhabi Ports in Q2 2015.
Imports by Standard International Trade Classification (SITC4): According to the report, "Machinery and transport equipment" was the largest contributor to imports by SITC4 in Q2 2015, representing 50.8 percent of the total. Its value increased by AED 1.4 billion (10.7 percent) compared with Q2 2014. The main contributors to this increase were the sub-sections "Other transport equipment", which advanced by AED 1.3 billion in Q2 2015.
The second largest SITC4 section in Q2 2015 was "Manufactured goods classified by material", representing 19.3 percent of imports in the second quarter "Chemicals and related products", which accounted for 9.6 percent of Q2 imports.
These top three sections contributed 79.8 percent of the total value of imports in Q2 2015, compared with 80.6 percent in Q2 2014.
Imports by Broad Economic Categories (BEC): As SCAD’s report finds, "Industrial supplies not elsewhere specified" was the largest BEC category of imports in Q2 2015 representing 36.4 percent of the total value, having grown by AED 522 million (5.2 percent) compared Q2 2014.
The second largest BEC category was "Capital goods (except transport equipment)", which increased by AED 1.8 billion (26.7 percent) compared with the Q2 2014 value, while the third largest BEC category, "Transport equipment and parts", declined by AED 364 million (5.2 percent) over the same period.
The combined contribution of the aforesaid three BEC categories in Q2 2015 was 87.8 percent, up from 86.1 percent in Q2 2014.
Imports by Harmonised System (HS Chapter): The 6.1 percent y-o-y rise in the value of imports in Q2 2015, was mainly due to an increases of AED 1.7 billion in "Ships, boats and floating structures" and AED 1.0 billion in "Pearls, precious metals, stones and articles thereof".
Imports by continent: With a share of 48.9 percent, Asia represented the leading source of imports through the ports of Abu Dhabi during Q2 2015, compared with 26.0 percent and 15.0 percent for imports from Europe and North America, respectively.
Imports by country: A comparison by country shows that the top ten imports partners contributed 69.1 percent of total imports in Q2 2015. The United States of America was the leading source, supplying goods worth AED 4.0 billion, an increase of AED 821 million (25.8 percent) compared with Q2 2015.
Non-oil exports by Standard International Trade Classification (SITC4): The report reveals an increase of AED 4.4 billion (97.5 percent) in the value of non-oil exports during the second quarter of 2015 compared with the same period in previous year, with "Commodities and transactions not classified elsewhere" as the largest SITC section, having increased by AED 4.3 billion in Q2 2015. The second largest SITC4 section was "Manufactured goods classified by material", (although it fell by 10.6 percent), followed by "Chemicals and related products" (up 9.3 percent) over the period under comparison.
The three section SITC sections accounted for a combined share of 90.6 percent of Abu Dhabi’s non-oil exports during the second quarter of 2015 compared with 87.1 percent in Q2 2014.
Non-oil exports by Broad Economic Categories (BEC): The largest BEC category of non-oil exports in the second quarter of 2015 ("Industrial supplies not elsewhere specified") contributed 87.0 percent of Q2 exports. This category showed an increase of AED 3.9 billion (up 100.1 percent) compared with Q2 2014.
The second largest BEC category was food and beverages, followed by consumer goods not elsewhere specified. The top three BEC categories contributed 97.5 percent of the total value of non-oil exports in Q2 2015, compared with 92.7 percent in Q2 2014.
Non-oil Exports by the Harmonised System (HS) Chapters: The rise in non-oil exports during the period was mainly due to an increase of AED 4.4 billion in the exports of "Pearls, precious metals, stones and articles thereof", partially offset by decreases of AED 257 million in the exports of "Aluminium and articles thereof" and AED 248 million in the exports of "Copper and articles thereof".
Non-oil exports by continent: Asia was the leading destination (receiving 63.8 percent) for Abu Dhabi non-oil exports during Q2 2015. The next largest continents were Europe and Africa contributing 32.1 percent and 2.8 percent of the total value of non-oil exports in Q2 2015, respectively.
Non-oil exports by country: SCAD’s report shows that the top ten export partners contributed 88.3 percent of total non-oil exports in Q2 2015. Saudi Arabia was the leading destination, receiving merchandise worth AED 2.6 billion, up AED 1.1 billion (73.8 percent) compared with Q2 2014. There were increases in non-oil exports to Switzerland by AED 2.6 billion, Kuwait by 228 million and Hong Kong (up AED 210 million) over the period.
Re-exports by Standard International Trade Classification (SITC4): "Machinery and transport equipment" was the largest contributor to the total value of re-exports during Q2 2015 representing 54.3 percent of the total value, a decrease of AED 589 million (20.3 percent) compared with Q2 2014.
The second and third largest sections, "Miscellaneous manufactured articles" and "Chemical and related products", grew by 9.7 percent and 56.4 percent, respectively.
The top three sections contributed 87.5 percent of total re-exports in Q2 2015, compared with 89.2 percent in Q2 2014.
Re-exports by Broad Economic Categories (BEC)/; According to the report, "Consumer goods not elsewhere specified" was the largest BEC category of re-exports in Q2 2015 representing 32.3 percent of the total value. The second largest category was "Capital goods (except transport equipment)", followed by "Transport equipment and parts".
The top three BEC categories contributed 86.6 percent of total re-exports in Q2 2015, compared with 91.0 percent in Q2 2014.
Re-exports by Harmonised System (HS Chapter): The 7.3 percent drop in the value of re-exports in Q2 2015 was due mainly to a fall of AED 569 million in "Machinery, mechanical appliances and parts".
Re-exports by continent: Asia was the top destination for Abu Dhabi’s re-exports in Q2 2015, importing 88.8 percent of the total re-exports, followed by Europe, which accounted for 8.7 percent to the total value of re-exports in Q2 2015.
Re-exports by country: The top ten re-export partners contributed 83.9 percent of total re-exports in Q2 2015. The leading re-exports destination was Saudi Arabia (27.3 percent of the total) followed by Kuwait (14.2 percent), the Kingdom of Bahrain (13.9 percent) and Qatar (13.2 percent).
WAM/AAMIR/Moran


Add new comment